Two DigiPen professors have teamed up with a student to create a tropical cyclone monitoring tool that scientists at NASA are already praising and using in their research. The project, as well as the professors’ related work in atmospheric electricity, is being funded by a National Science Foundation (NSF) grant.
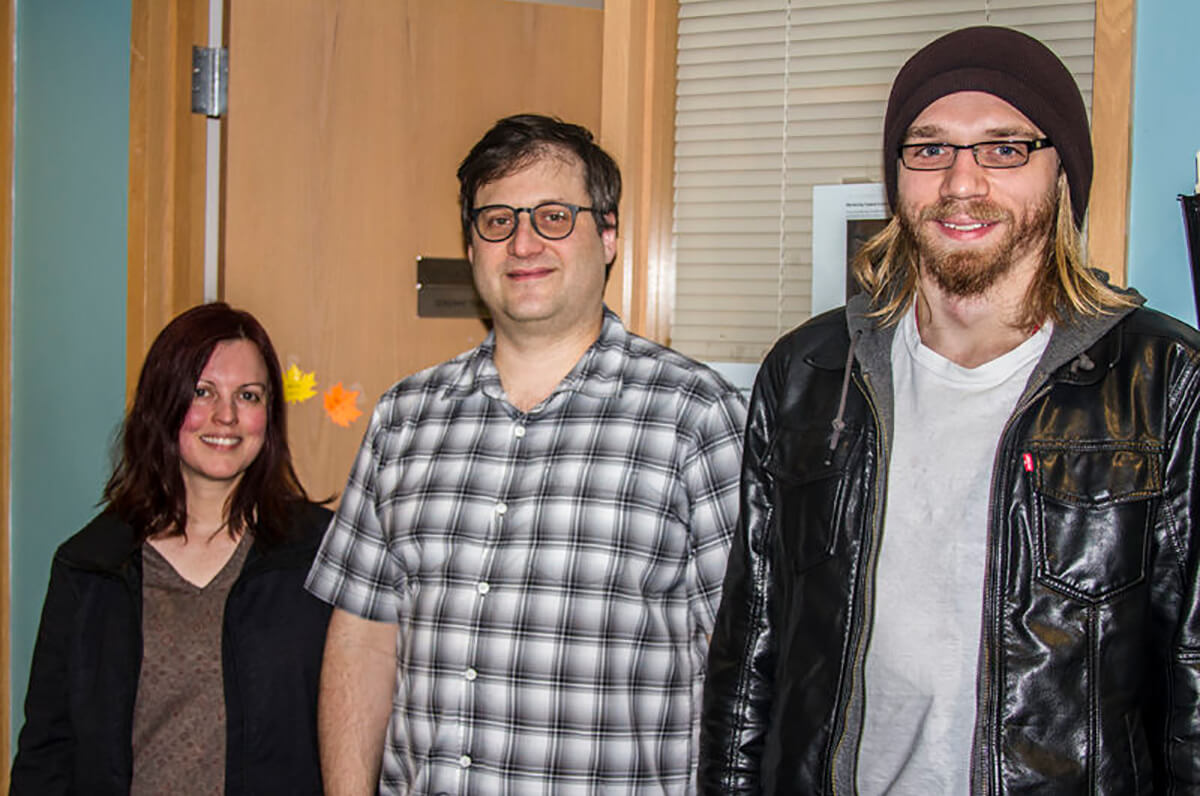
Physics Department Chair Natalia Solorzano and Electrical and Computer Engineering Department Chair Jeremy Thomas, who joined forces with 2017 BS in Computer Science graduate Connor Bracy on the project, successfully passed their first major stress test during last year’s unexpected barrage of massive hurricanes.
The tool, called WWLLN-TC (short for World Wide Lightning Location Network – Tropical Cyclones), monitors storms by tracking data in near real-time. It specifically tracks the basic components necessary to produce lightning. “[That includes] water and ice in the cloud and intensity of upward directed wind known as convection,” Solorzano says. Taken altogether, these components and the resultant lightning relate to the intensity and persistence of tropical cyclones, a relationship that Solorzano and Thomas helped discover ten years ago.
“Many decades ago, people thought there wasn’t lightning near the eyewall of tropical cyclones at all,” Solorzano says. “They just assumed there was no lightning because of the pressure conditions.”
As access to lightning data improved and models on tropical cyclones started coming in, scientists began to realize there was indeed lightning in tropical cyclones, however, most lightning sensors were land-based and had a very limited range. “That made it really hard to describe,” Solorzano says. Due to that short range, most research on the potential relationship between lightning and tropical cyclones was limited to the period just before tropical cyclones made landfall — not the majority of the storms’ life out over the ocean.
This problem was addressed in 2008 when Solorzano, Thomas, and University of Washington Earth and Space Sciences professor Robert Holzworth published their joint paper, “Global Studies of Tropical Cyclones Using the World Wide Lightning Location Network.” If the paper’s title sounds familiar, that’s because it should — the WWLLN (pronounced “woolen”) was as central to the 2008 paper as it is to today’s WWLLN-TC.
Fully operational since 2006, the WWLLN is a cooperative global network composed of low-cost antennae stationed on the roofs of roughly 100 universities around the world. Although the antennae are land-based, the fact that there are so many operating in tandem drastically expands their lightning detection range.
“If you get four or five stations picking up electromagnetic (EM) radiation from one lightning event, you can use the time of arrival of the EM waves at the stations to determine where [the lightning] happened,” Thomas says. “So this revolutionized being able to pick up lightning over the ocean. Lightning over the ocean was detectable before only if you had a satellite that happened to see it.”
Utilizing data obtained from WWLLN, Solorzano and Thomas’ 2008 paper was one of the first written on tropical cyclones that examined lightning data from the storm’s entire lifespan — from ocean to landfall. As a result, they discovered that a tropical cyclone’s “intensity changes are related to the density of lightning strokes,” a discovery that eventually led them to create WWLLN-TC.
To monitor tropical cyclones, Solorzano and Thomas began combining that crucial WWLLN lightning data with publicly available information from low-orbit NASA and NOAA microwave satellites — which relay important information on other key lightning “ingredients” like ice and liquid water levels in clouds — and running the two combined data sets through mathematical models.
“We used to have to do this all by hand and kind of piecemeal everything together for case studies,” Thomas says. “But there are about a hundred of these storms a year, so of course we wanted to automate all these calculations together in real time, which is where Connor came in.”
At the time, student Connor Bracy needed a new computer science project to work on, and Solorzano and Thomas were happy to recruit him. DigiPen student Matthew Wendel had built a prototype WWLLN-TC site by the time Bracy entered into the project, but Wendel hadn’t had much time to develop it before he graduated in 2015. Bracy was able to use Wendel’s foundation as a launching pad, utilizing a programming language named MATLAB to synthesize the WWLLN data with the NASA satellite data. At first, the calculations were sluggish due to the sheer volume of data that needed to be churned in the already memory-intensive process.
After implementing “incremental processing,” which saves the system time by only processing new data rather than reprocessing data from the entire storm’s lifespan for every update, WWLLN-TC’s results went from one update every three hours to near real-time storm monitoring.“In the thick of it during storm season, there would be some storms that had two weeks’ worth of data, and on top of that there would be 15 storms that needed processing,” Bracy says. “But then there would be a few storms in that mix that were so massive, they alone would take half an hour to 45 minutes to process.”
“That was the stress test,” Thomas says. “He was the one who had to make sure the real-time data was really real-time, and other people were asking about it — not just us.”
One of those people was NASA’s Owen Kelley, a hurricane researcher whose job is to stay on top of storm information day and night throughout the season, Thomas says. Kelley found the WWLLN-TC an incredibly valuable tool, especially as Hurricane Maria began its devastating barrage on Puerto Rico. When the hurricane took out the National Weather Service’s land-based radar in Puerto Rico, WWLLN-TC’s unique network-based setup came through.
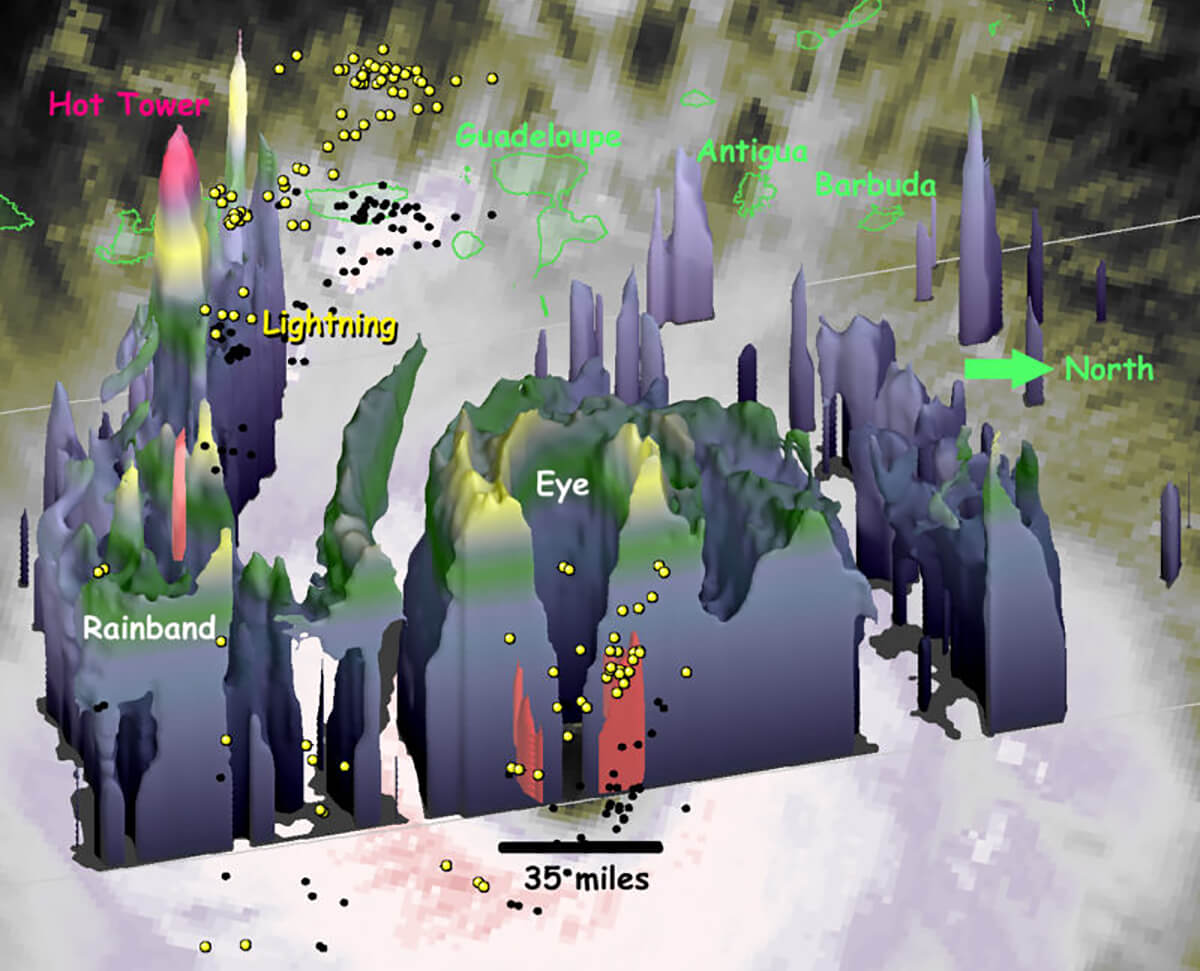
A 3D visualization of Hurricane Irma generated by Owen Kelley utilizing WWLLN-TC data. Courtesy NASA Goddard/WWLLN
“He was emailing us in real time saying, ‘The radar got knocked out over in Puerto Rico, WWLLN is working, thanks,’” Thomas says. “And then he was asking us for more. ‘Can you give me this? Can you give me this?’ And it was stuff we hadn’t implemented on the website yet.”
While Bracy is happy NASA is using his tool, he’s also glad he was getting updates and questions about it from Solorzano and Thomas alone.
“I wasn’t getting pressure from NASA directly, thank God,” Bracy laughs. “Every time I’d push an update, my heart would stop just thinking about getting a text or an email or a call like, ‘Oh god, this thing blew up! What happened?!’”
Kelley took the data from WWLLN-TC to create 3D visualizations of the storm, something the DigiPen team is planning on having the tool do automatically in the near future.
Bracy is currently working as an intern for Solorzano and Thomas while finishing his second undergraduate degree, a BS in Physics from the University of Washington. After graduating, he plans to pursue a Ph.D. in physics where his DigiPen computer science background will prove crucial in the design and implementation of experiments.
Solorzano and Thomas hope WWLLN-TC will serve as a boon in understanding the physics of lightning and how it relates to global meteorological and energy systems in general — all to address daunting questions proposed by 1927 Nobel prize winner C.T.R. Wilson that still haven’t been fully answered by scientists. How exactly do clouds create and store electrical energy, and do these clouds generate the global atmospheric circuit? For now, that behavior is still something of a mystery, leaving physicists to rely on old, imperfect models.
“So that’s the ultimate goal — it’s a big-data kind of approach,” Solorzano says. “Since we can’t really explain the physics, and we never really will be able to describe the physics — I mean, we are lightning scientists, and even we can’t explain how the cloud gets charged — we decided to gather as much data as we could and try to make sense of it, and potentially come up with a new, better model.”